
Why do so many retailers still use sales to assess store performance? When all you have is transaction data with out traffic, you are going to suffer a 'transaction misdirection'.
Sales transactions are outcomes. A sale is what happens if you successfully convert a shopper into a buyer. While traffic and transactions are obviously related, relying on transaction counts as a proxy for store traffic is a big mistake.
Let's look at series of four charts to illustrate the problem:
The chart shows sales transaction counts for a big-box specialty retailer over a three-week period. From the transaction count trend, it’s obvious that there’s not a whole lot going on. despite a promotion that ran during Week #2.
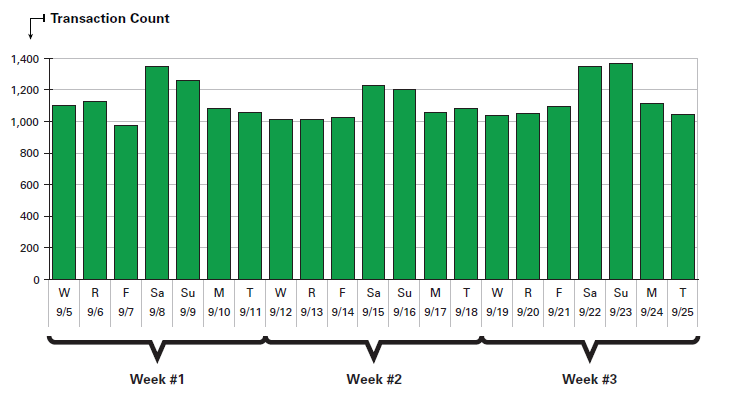
How would you think about results if this were your promotion and your sales results?
Click through the 4 Tabs above for surprising results:
- Tab 2: Promo Week sales compared to other weeks
- Tab 3: Layer in Traffic Opportunity
- Tab 4: Overlay Conversion Rates
Looking at week-over-week comparisons, Promo Week (Week #2) had:
- 5% fewer transactions than Week #1
- 6% fewer than Week #3.
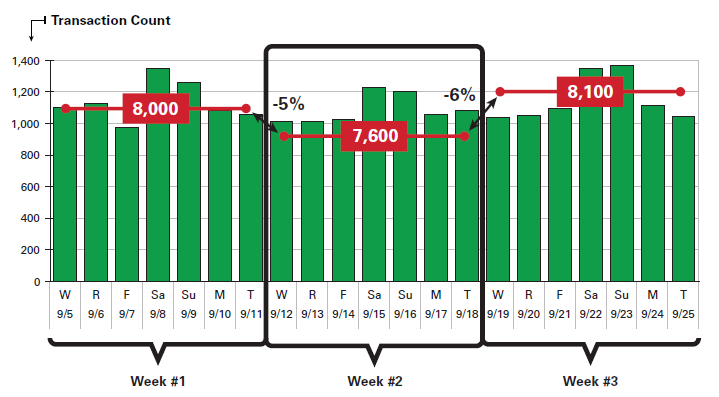
Average ticket values were substantially similar across all three weeks so overall sales trends correlated perfectly to transactions. If average sale values don’t change, sales will always mirror transactions.
Back to evaluating Promo Week. It's not good news!
How can you run a promotion and have transactions and sales go down? It doesn’t make any sense. As it turns out, it makes perfect sense when you look at the traffic and customer conversion data.
Click Tab 3 to see what happens when we layer in Traffic Opportunity.
The sales results don’t change, but how we interpret them most certainly does!
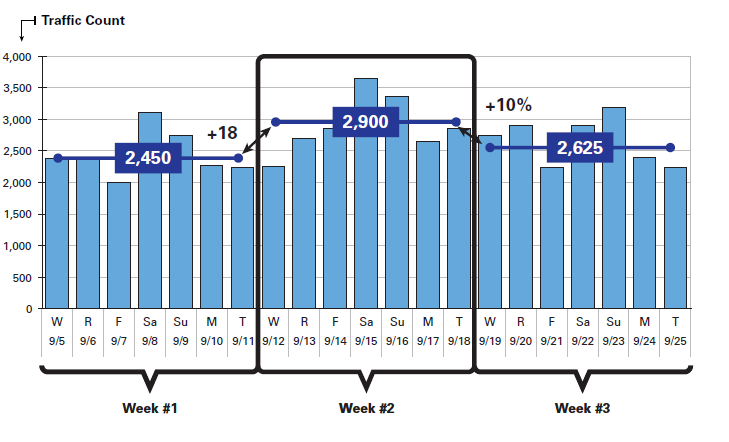
Let’s start with store traffic. As shown in the chart above, store traffic during Week #2 was actually up compared to both other weeks. Up significantly! — by 18% compared to Week #1 and 10% compared to Week #3.
Store traffic defines the sales opportunity. So...the opportunity got bigger during Promo Week. Yet, sales went down.
Click Tab 4 to see an overlay of Conversion which sheds some light on what happened.
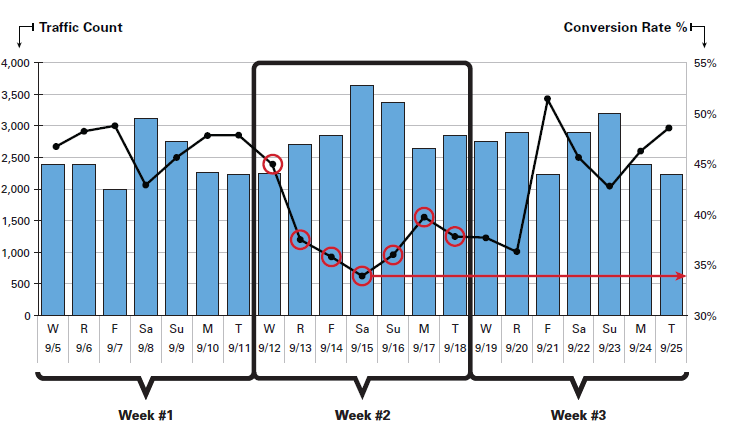
Traffic went up, but customer conversion rates fell significantly during Promo Week:
Down 20% compared to Week #1
Down 15% compared to Week #3
With traffic and conversion data, the impact is clear – there was a significant increase in store traffic during Promo Week, but the store seriously failed to convert these shoppers into buyers.
Note: Traffic and conversion tend to be inversely related because as the store gets busier it can be harder to serve everyone, but what a waste of traffic and marketing spend.
If you were responsible for the marketing investment... or store performance...what would you do differently if you had this data at your fingertips when evaluation promotions?
In the example above, if this specialty retailer could have held on to the conversion rate it had averaged for the week before and after the Promo Week, the increased traffic (opportunity) from the promotion would have generated 9,000 additional transactions — 11% - 12.5% more than the other two weeks.But...you cannot solve, what you cannot see.
By breaking out store traffic and customer conversion rates, we can clearly see what drove results.
But if you didn't have traffic data and had to evaluate the Promo Week based on transaction counts alone, it would have been very easy to incorrectly assume that there had been a slight drop-off in traffic.
With traffic and conversion data, the picture is clear; we drove more traffic into the store, but we failed to capitalize on it. And we can now ask: What really went wrong?
We know from actually working with this retailer that it turned out to be a stock-out situation on a number of high-demand SKUs. Looking at this in context of traffic and conversion, they could quantify what the stock-outs cost them.
As you can easily imagine, the reverse can also happen. There could be fewer shoppers coming into the store, but because conversion rates go up (perhaps because the staff does a better job of converting the shoppers into buyers), transaction counts will increase.
To improve your sales, you need to understand what lever to pull. Traffic and customer conversion help you do that.