
No single metric defines the retail category as much as same-store sales do. Retailers live and die by this one simple measure. But, evaluating same-store sales in the context of retail shoppers (people who actually enter your store) and retail conversion (people who actually buy) will dramatically alter how your interpret your results.
Do you have retail foot traffic counts for each of your stores?
It doesn't count if you have data for just a handful of stores and are merely extrapolating traffic counts to your other locations. If you don't have retail foot traffic counts you are really not able to measure store performance at all. Read on to find out why.
Let's start with a definition: The terms 'same-store sales', 'comparable store sales', or 'comp sales' are used interchangeably. Comp-store sales are the accepted measure of retail performance.
Simply put, comp-store sales are defined as: A measurement of productivity in revenue which compares sales of retail stores that have been open for a year or more.
Measuring comp-store sales will help you identify how much of your chain’s sales growth is generated from existing stores rather than from new ones. The implication is that growing sales from your existing stores means that your chain is performing well.
You can easily generate more overall sales revenue by adding new stores; however, declining sales at existing stores (i.e., negative comp-store sales) is an ominous sign because you can’t keep adding stores indefinitely.
The comp-store sales metric nicely takes these new stores out of the performance equation.
Comp-store sales is obviously not the only metric used to evaluate retail performance, but it is by far the one most relied upon by retailers and the industry in general to assess individual store and overall chain performance. In fact, retail stocks tend to trade on same store sales performance more than on any other metric.
However, without the context that traffic and customer conversion data provide, you may misjudge store performance altogether. In the two example below, ask yourself how you feel when you see that comps are up or down over the May and June time period.
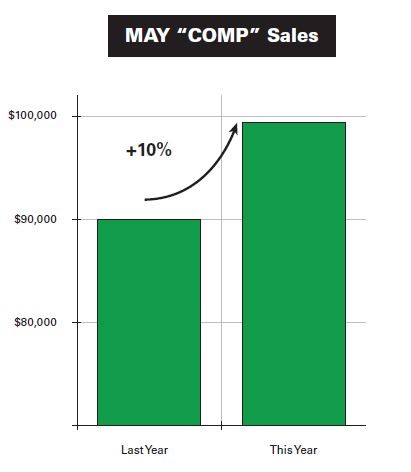
Let’s say that in May your top performing store was up 10% on a comp-store sales basis, and average ticket values and gross margins remained unchanged from a year ago. How do you feel? Comps are up 10%. Most retailers would consider this to be pretty solid performance.
Comps are up – comps are down: how do you feel?
But now let's consider that, in order to better understand what drove the strong performance, your Operations team pulled the monthly management report using their business analytics tool, and the summary results are displayed in the table below.
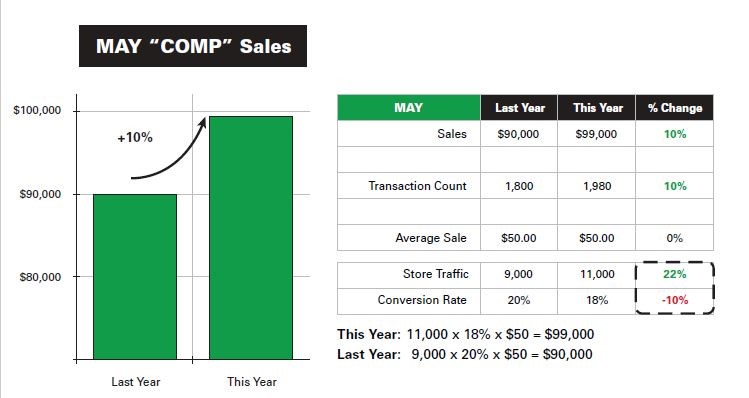
The data tell us what happened in May. Comp sales are up 10%, average sale values didn’t change, but the number of sales transactions grew by 10%.
Note: store traffic was up 10%, and that’s what drove the 10% comp sales increase.
Although marketing did a great job getting more shoppers in the store — that is not an indication of how well your stores performed. Now...Click the Next Tab to consider what happens in June.
In June, this same store had comp sales of -10%. As with May, average ticket value and gross margins remained unchanged from a year ago. These are very disappointing results – what happened? 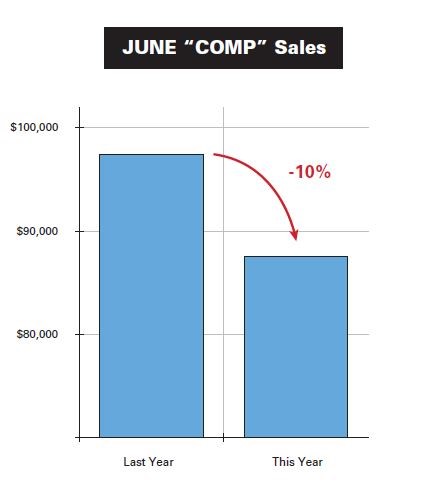
Once again, your Operations team pulls the monthly management report. Sales tanked, and you need to explain why. The summary results are shown in the table below. 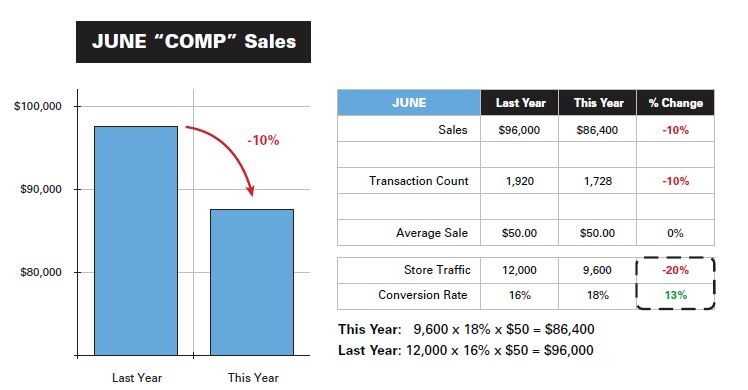
These data tell us why June was such a disaster. Comp sales were down 10%, average sale values didn’t change, but the number of sales transactions decreased by a whopping 10%.
Store traffic was down 10%, and that’s what drove comp sales down. You can question: "Why was traffic down 10%"?
But, importantly, because you have traffic data you can decode what actually drove the soft results and not be grasping blindly for explanations.
What same-store sales data tells you and what it doesn’t
As a metric, same-store sales does two very important things:
- It eliminates any incremental sales generated by new stores
- It accounts for seasonality.
Obviously, for most retailers, December is a huge sales month, so it would be meaningless to compare December sales to October sales.
Same-store sales are calculated by simply comparing sales results from stores that have been open for at least one full year and comparing them to only these same stores for a specific, comparable period of time (e.g. December sales this year versus December sales last year).
The problem with relying so heavily on comp sales is that it eliminates only new store incremental sales and seasonality — and nothing more. Given the “greatness” that has been bestowed upon this metric, you might think that it tells us more, but it doesn’t. Beyond new stores and the time of year, everything else is the same or comparable. Other than these two items, almost nothing is truly comparable.
-
Was the competitive landscape the same? -
Was your staff the same? -
Was the product offering the same? -
Was your advertising the same? -
Was the weather the same? -
Were economic conditions the same?
Virtually nothing was the same this year as it was last year.
Sales performance is relative. How can you know what 'good' or 'great' or even 'bad' performance is, without a comparison to what was possible? You can’t. And so, as great as comp-sales is as a performance metric, it tells us nothing about what the true opportunity was or what drove the performance.
While it’s good if comp sales are up, you can’t look at this one metric in isolation or without the context that other powerful metrics like traffic and customer conversion offer.
But don’t be fooled. How you delivered the results matters.
Here’s why:
Even though same-store sales are up, they could have been even better. With traffic and customer conversion data, you’ll know by how much – customer conversion enables you to quantify the potential.
If you want to continue to deliver positive same-store results, you need to understand what drove the results:
- Was it traffic?
- Customer conversion?
- Average sale?
- A combination of all three?
Transaction data and sales results don’t provide the answer.
Inevitably you will experience negative same-store sales. You need to understand what drove the results and, more importantly, what you have to do to turn the situation around.
Traffic and customer conversion analysis will provide you with the context you need to make the right decisions. If your comp sales are dropping because your customer conversion rates are dropping (i.e., your store personnel aren’t converting the traffic they are getting), driving more traffic into the stores won’t effectively — or at least not efficiently —improve sales results.
When things go bad, you need to understand what lever to pull. Traffic and customer conversion help you do that.